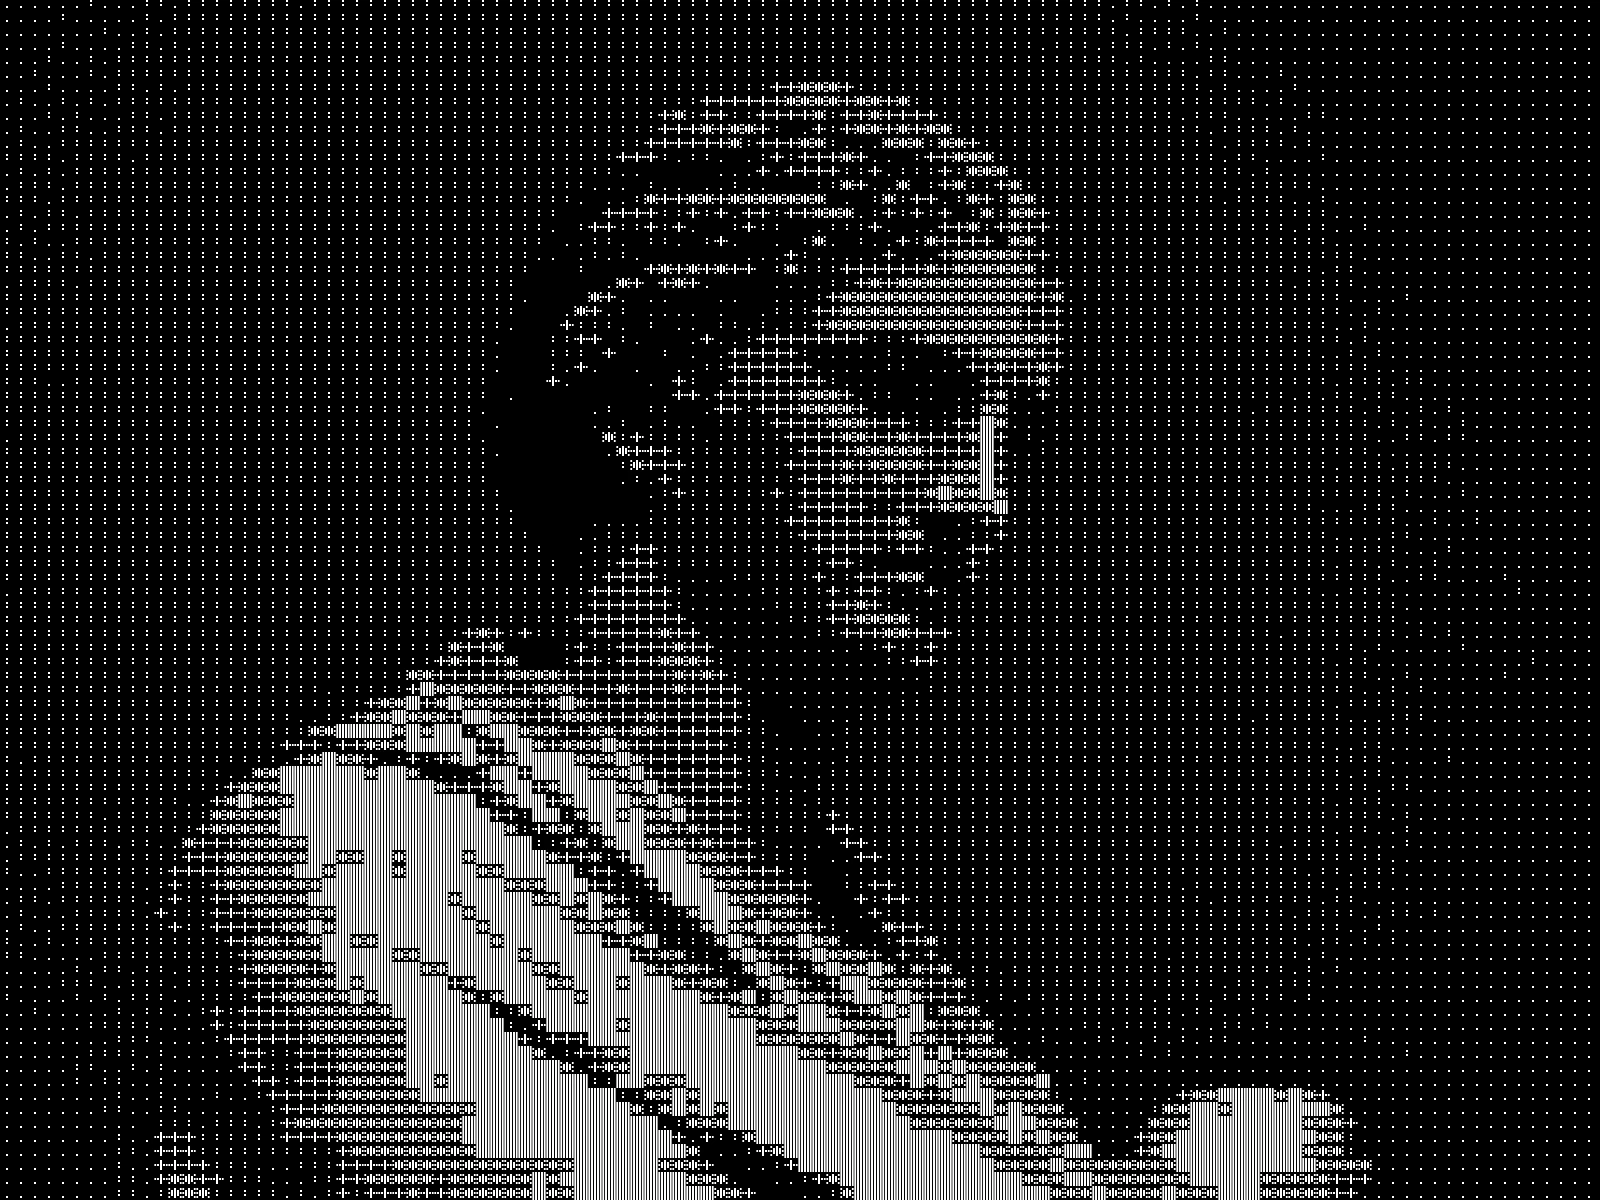
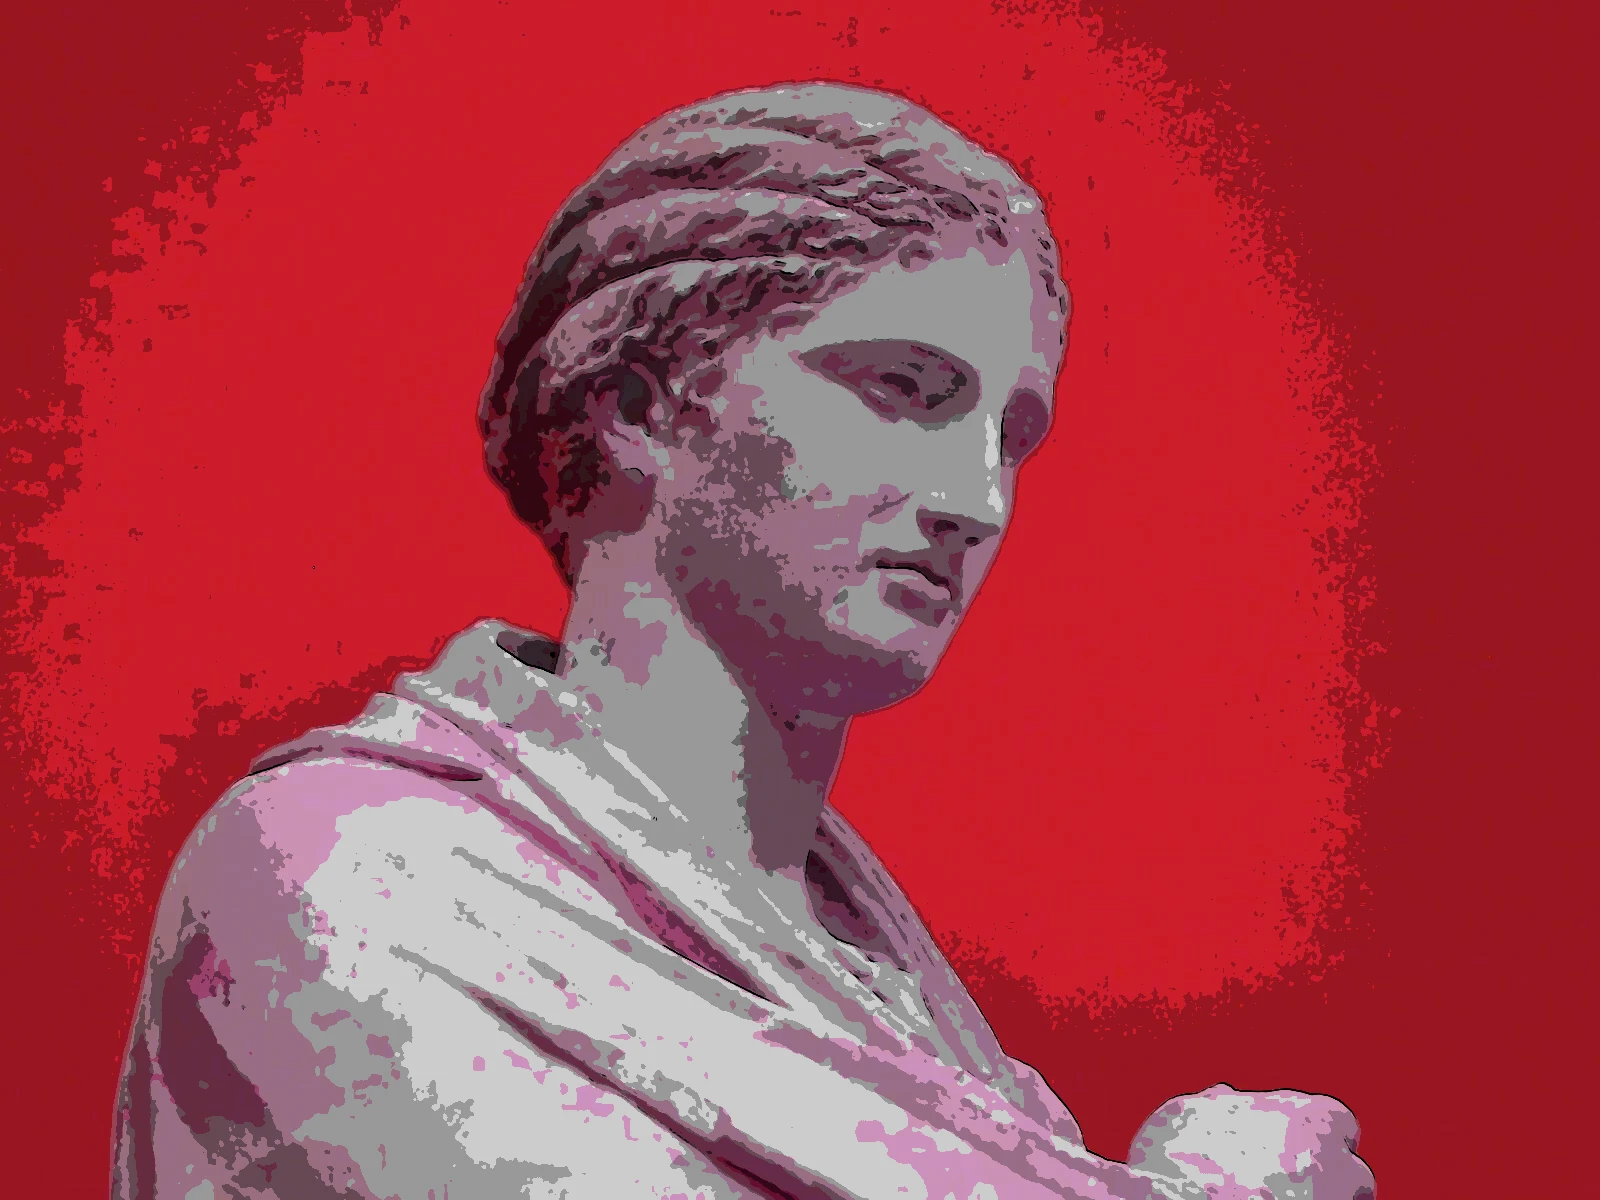
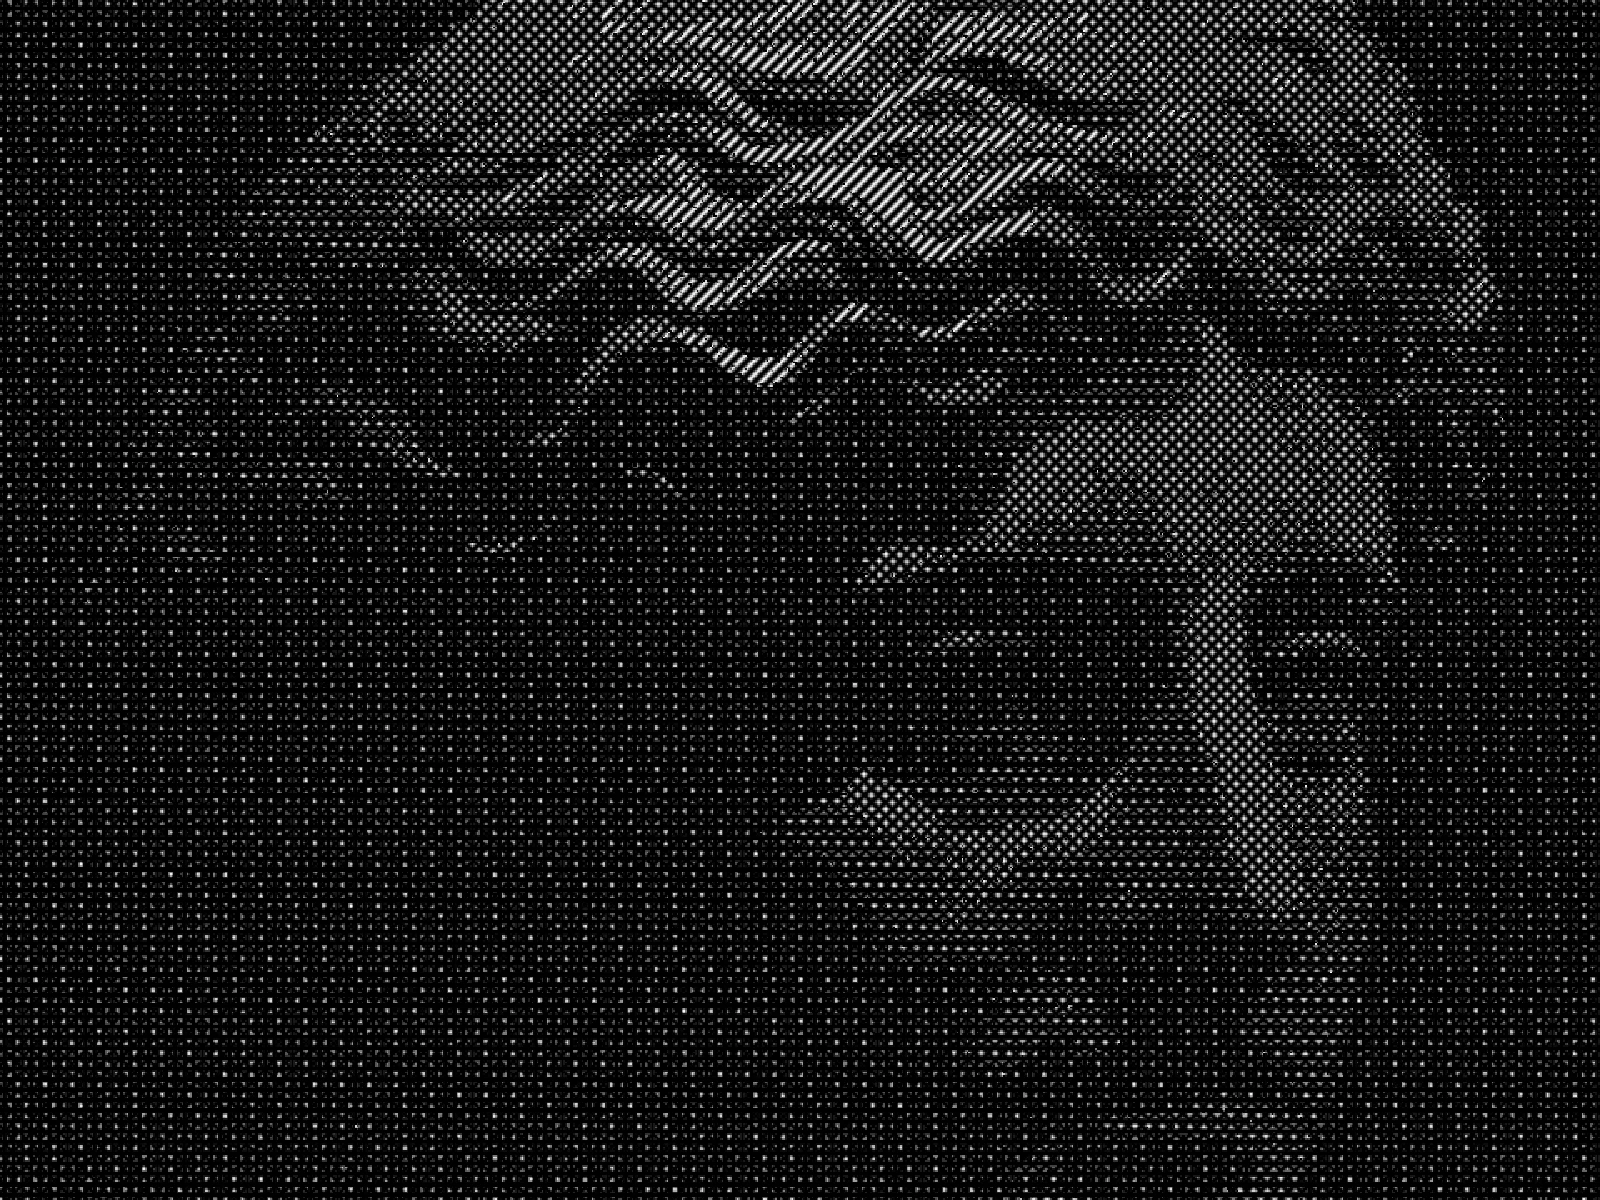
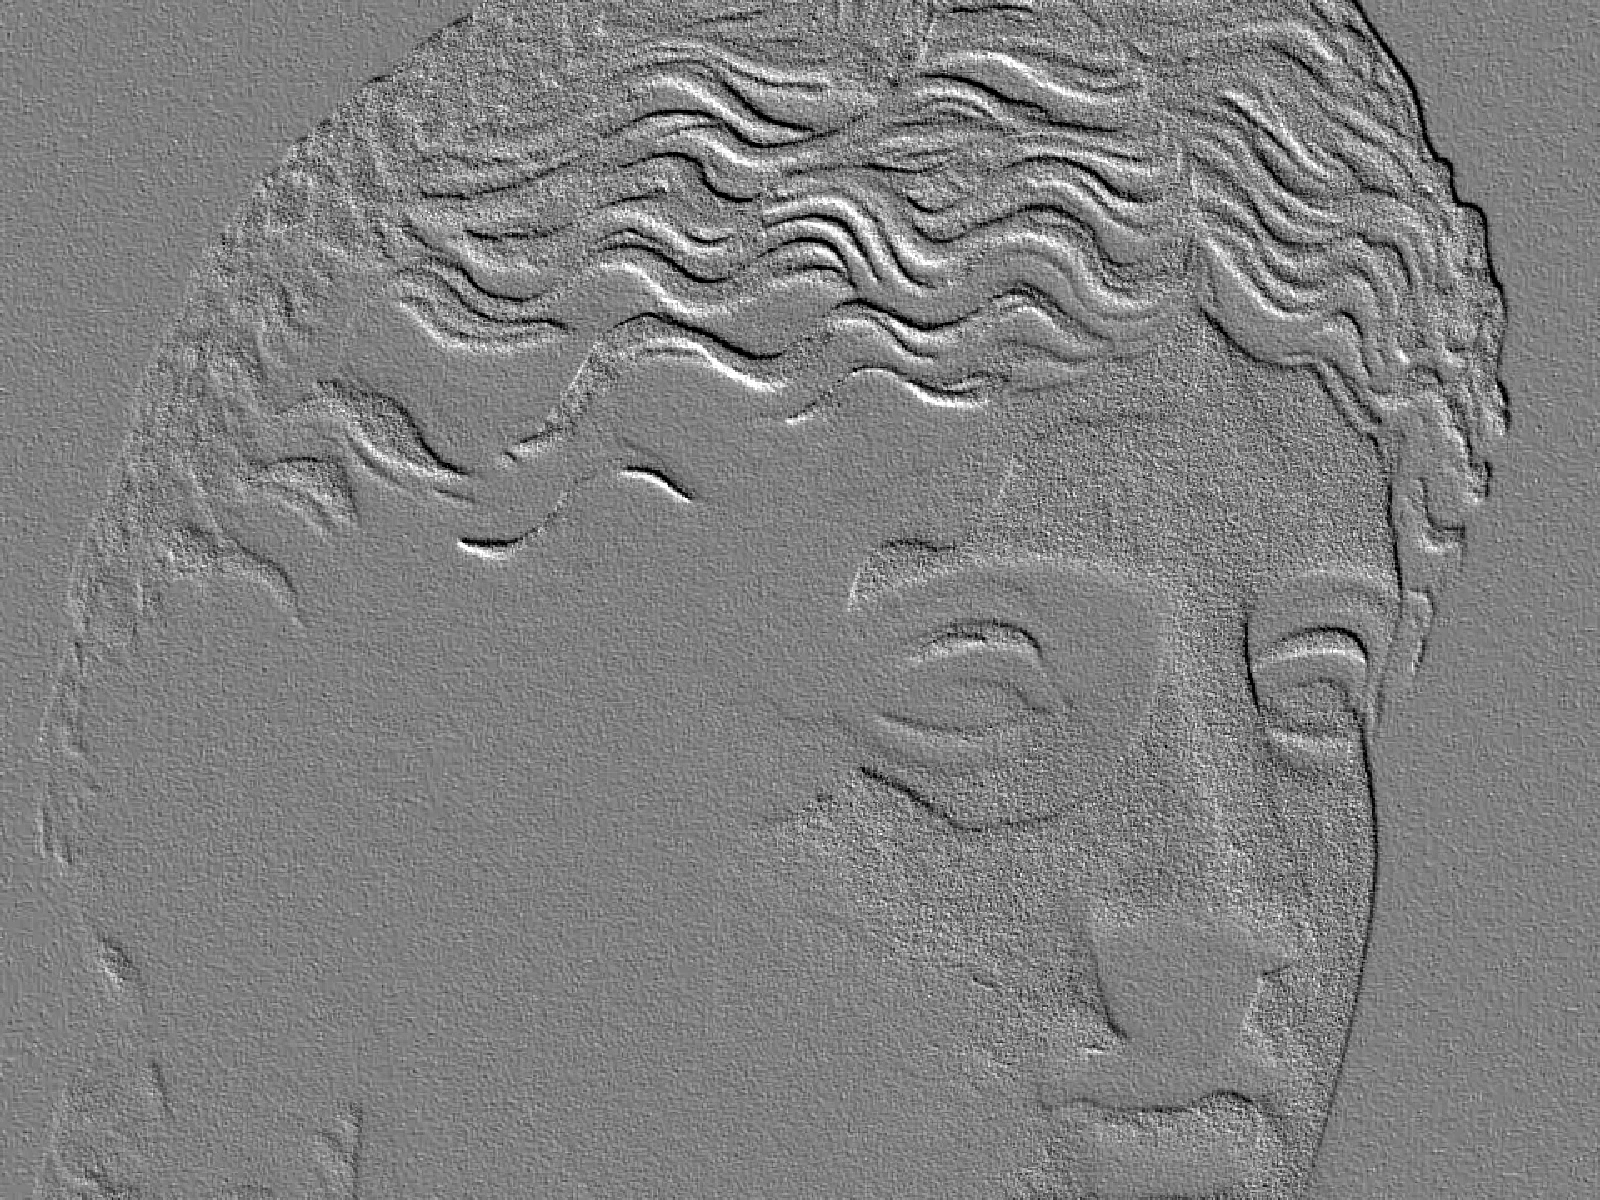
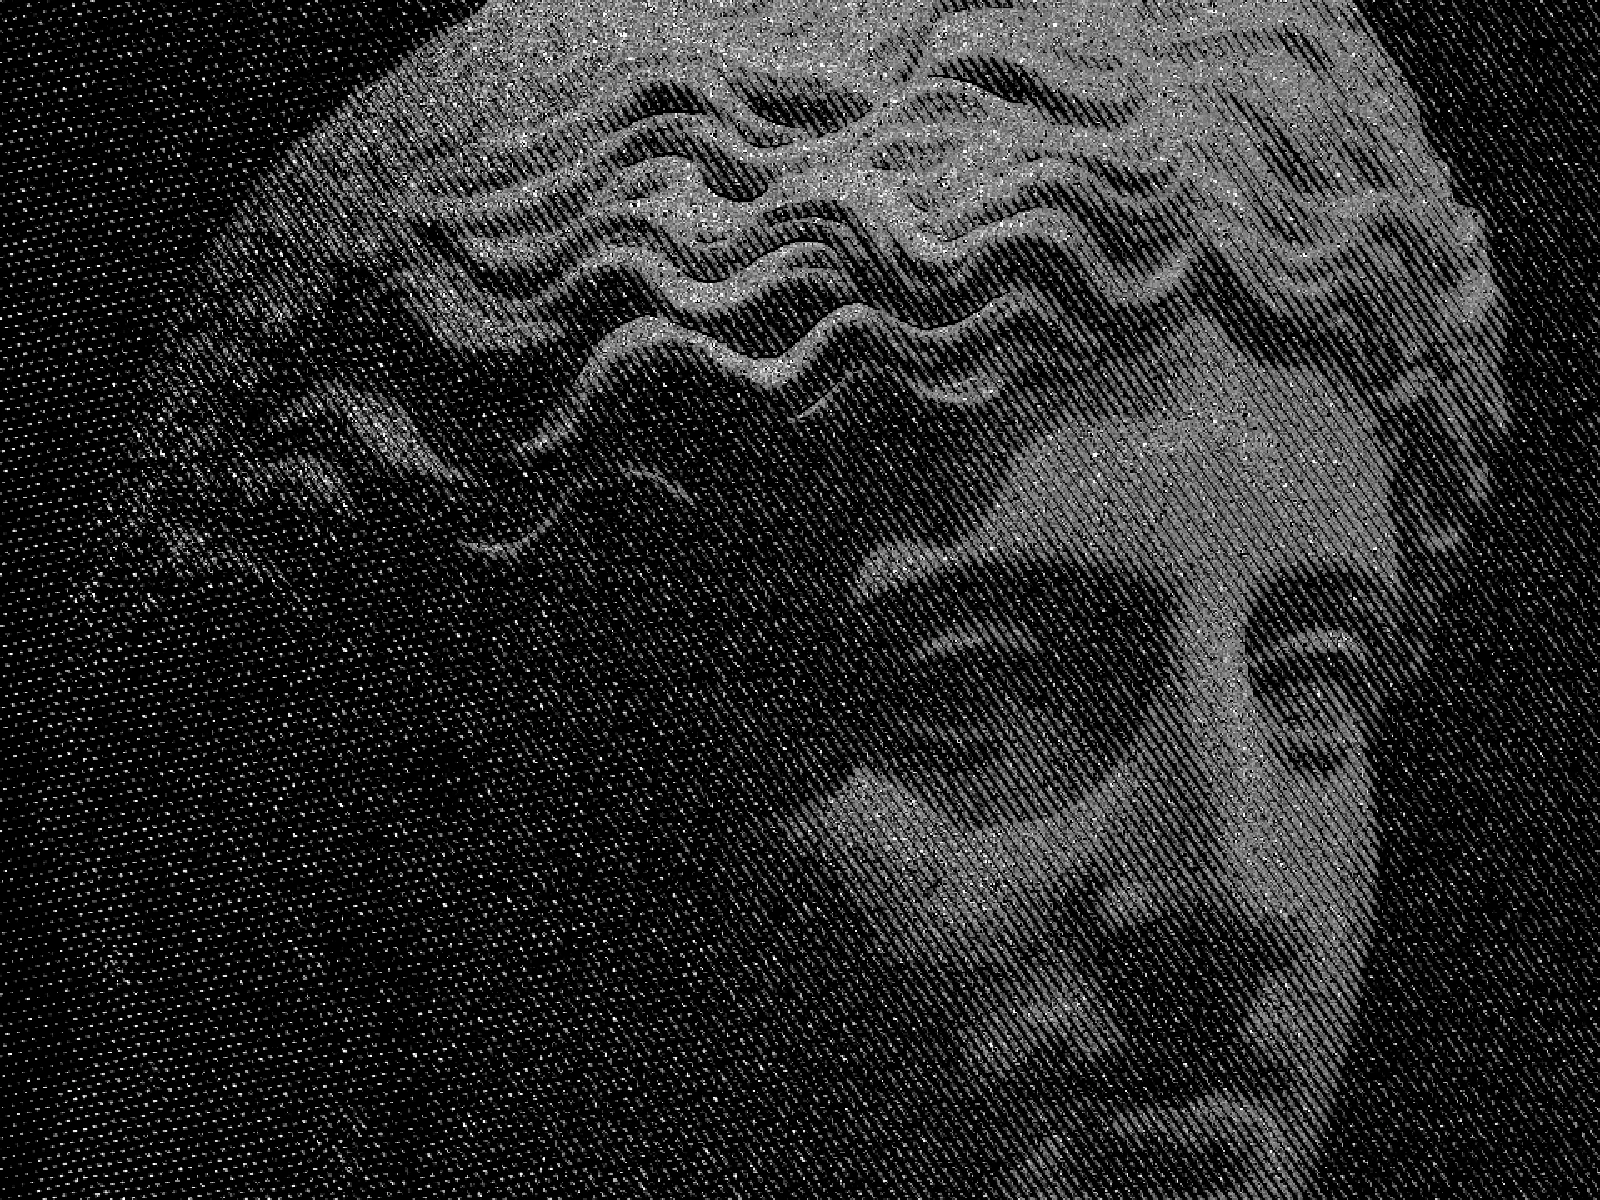
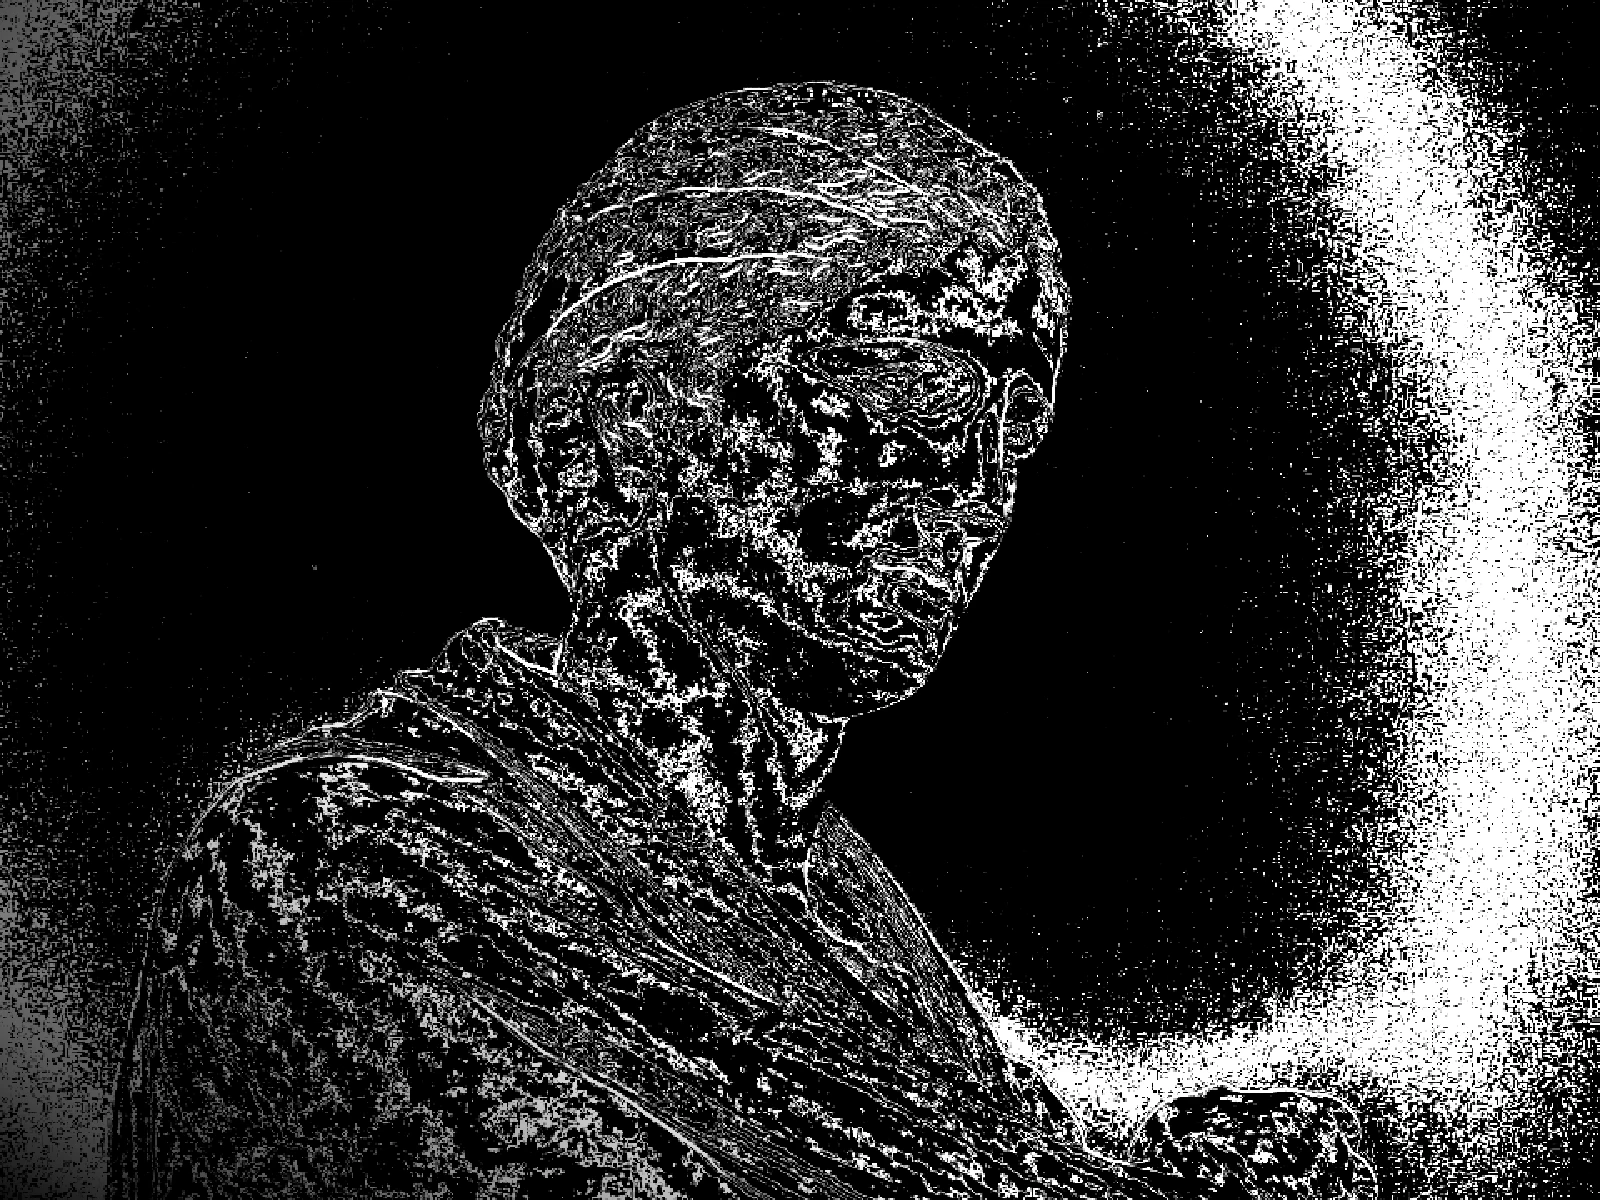
contour line effect
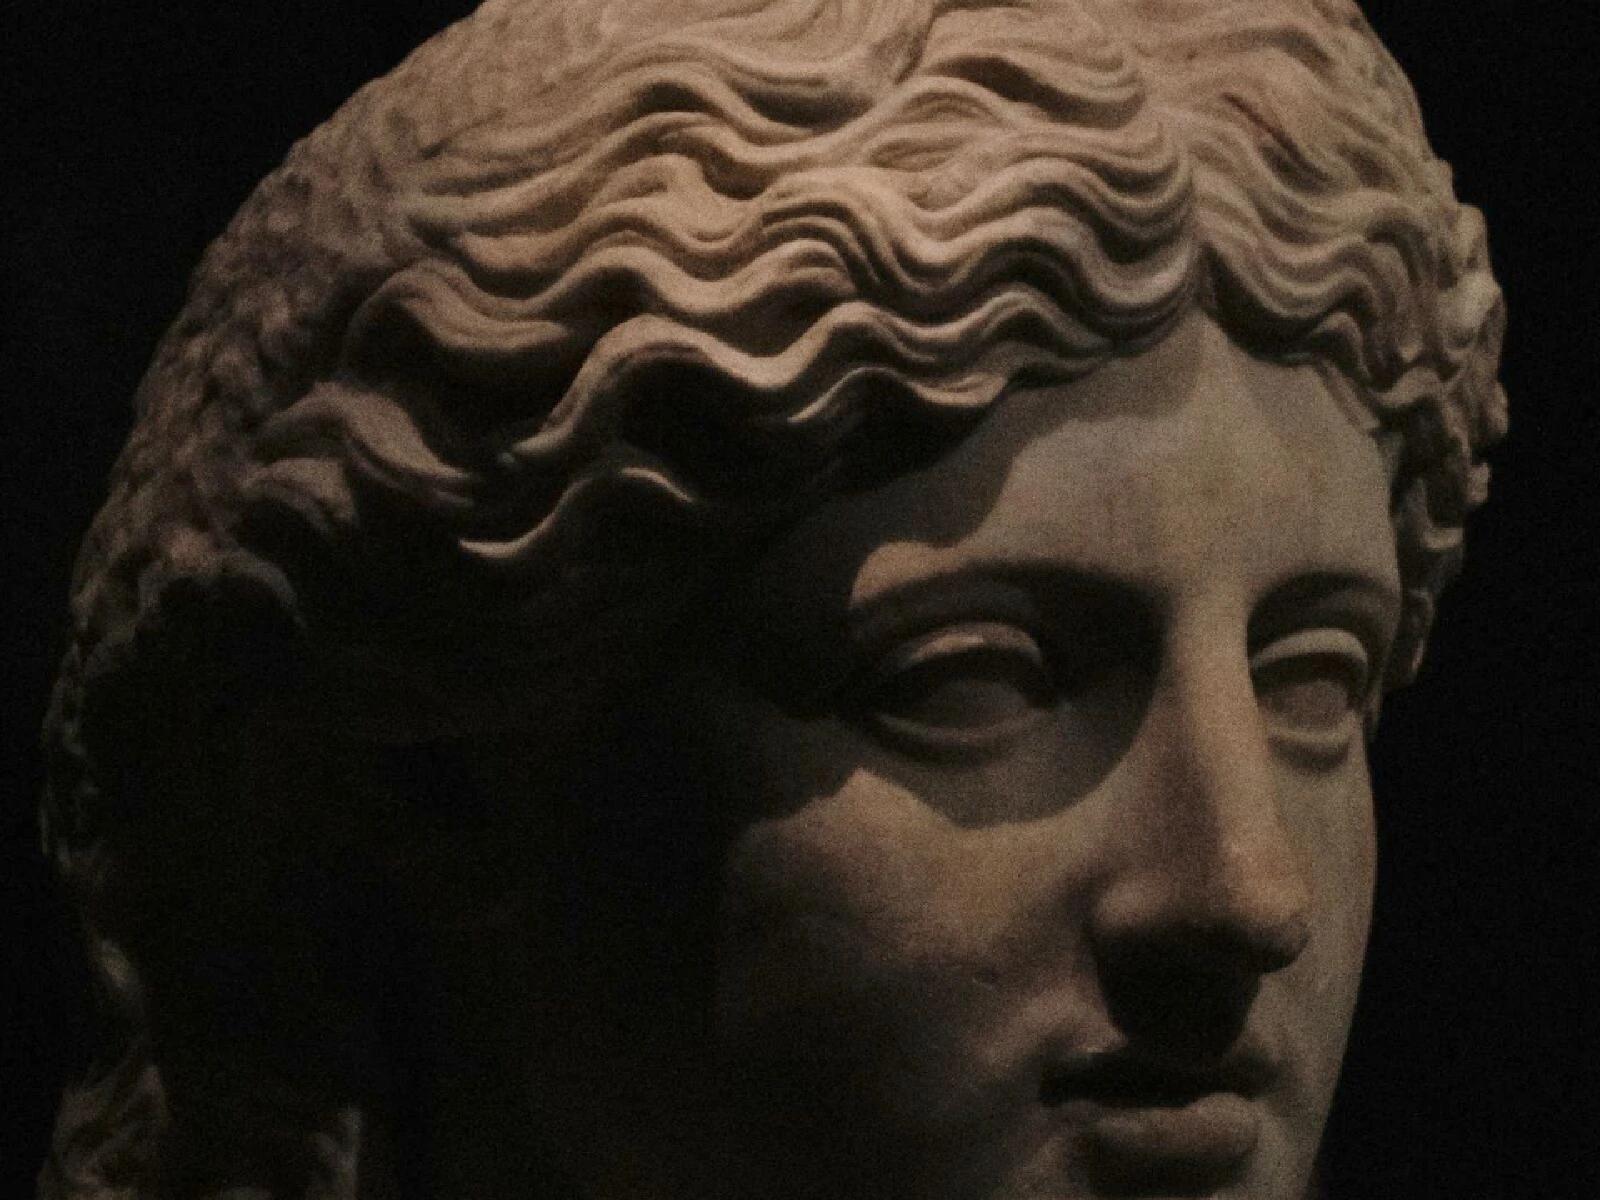
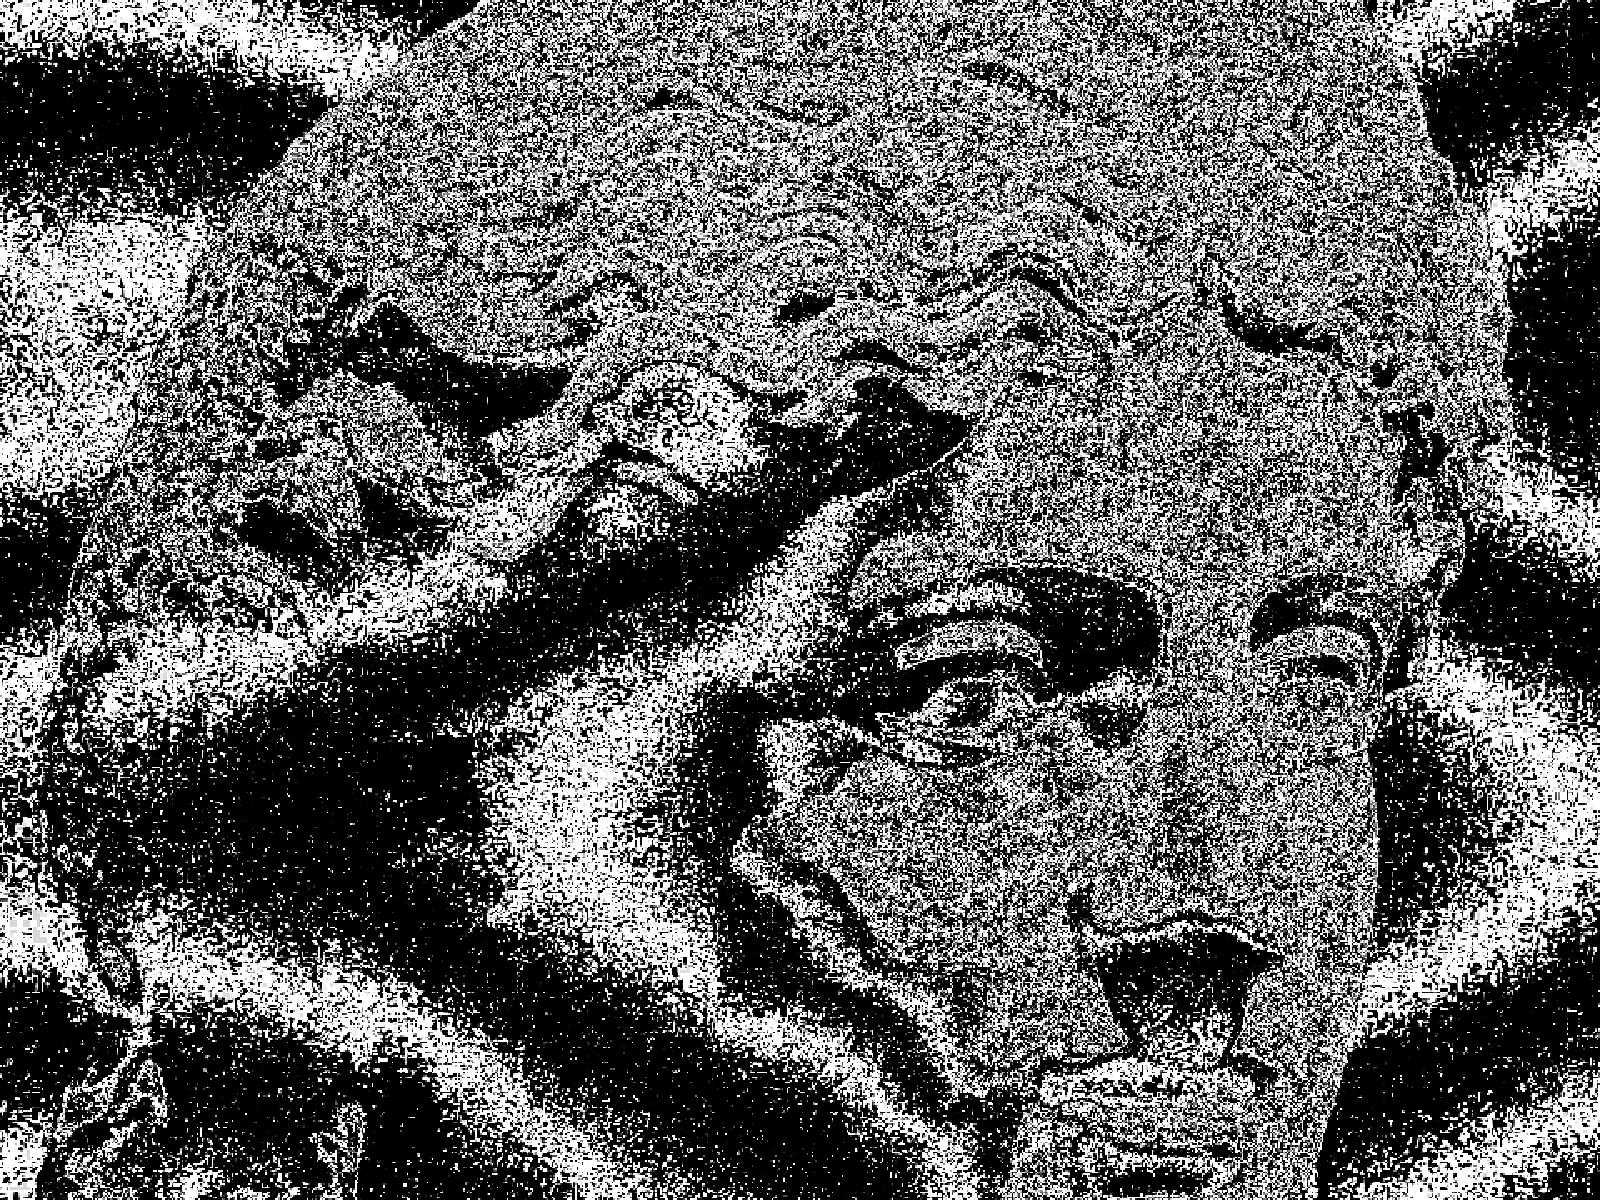 SourceEffect
01/ ORIGIN
Contour lines came from hydrography before they reached dry land: Dutch surveyors were drawing lines of equal depth on harbour charts by the seventeenth century, because a captain needs to know where the bottom is. Applying the same idea to elevation followed, and by the nineteenth century national surveys had standardised the convention. It works because a line of constant value tells you the shape of a surface without describing any point on it.
02/ SWEEP
LEVELS sweep
03/ SPEC
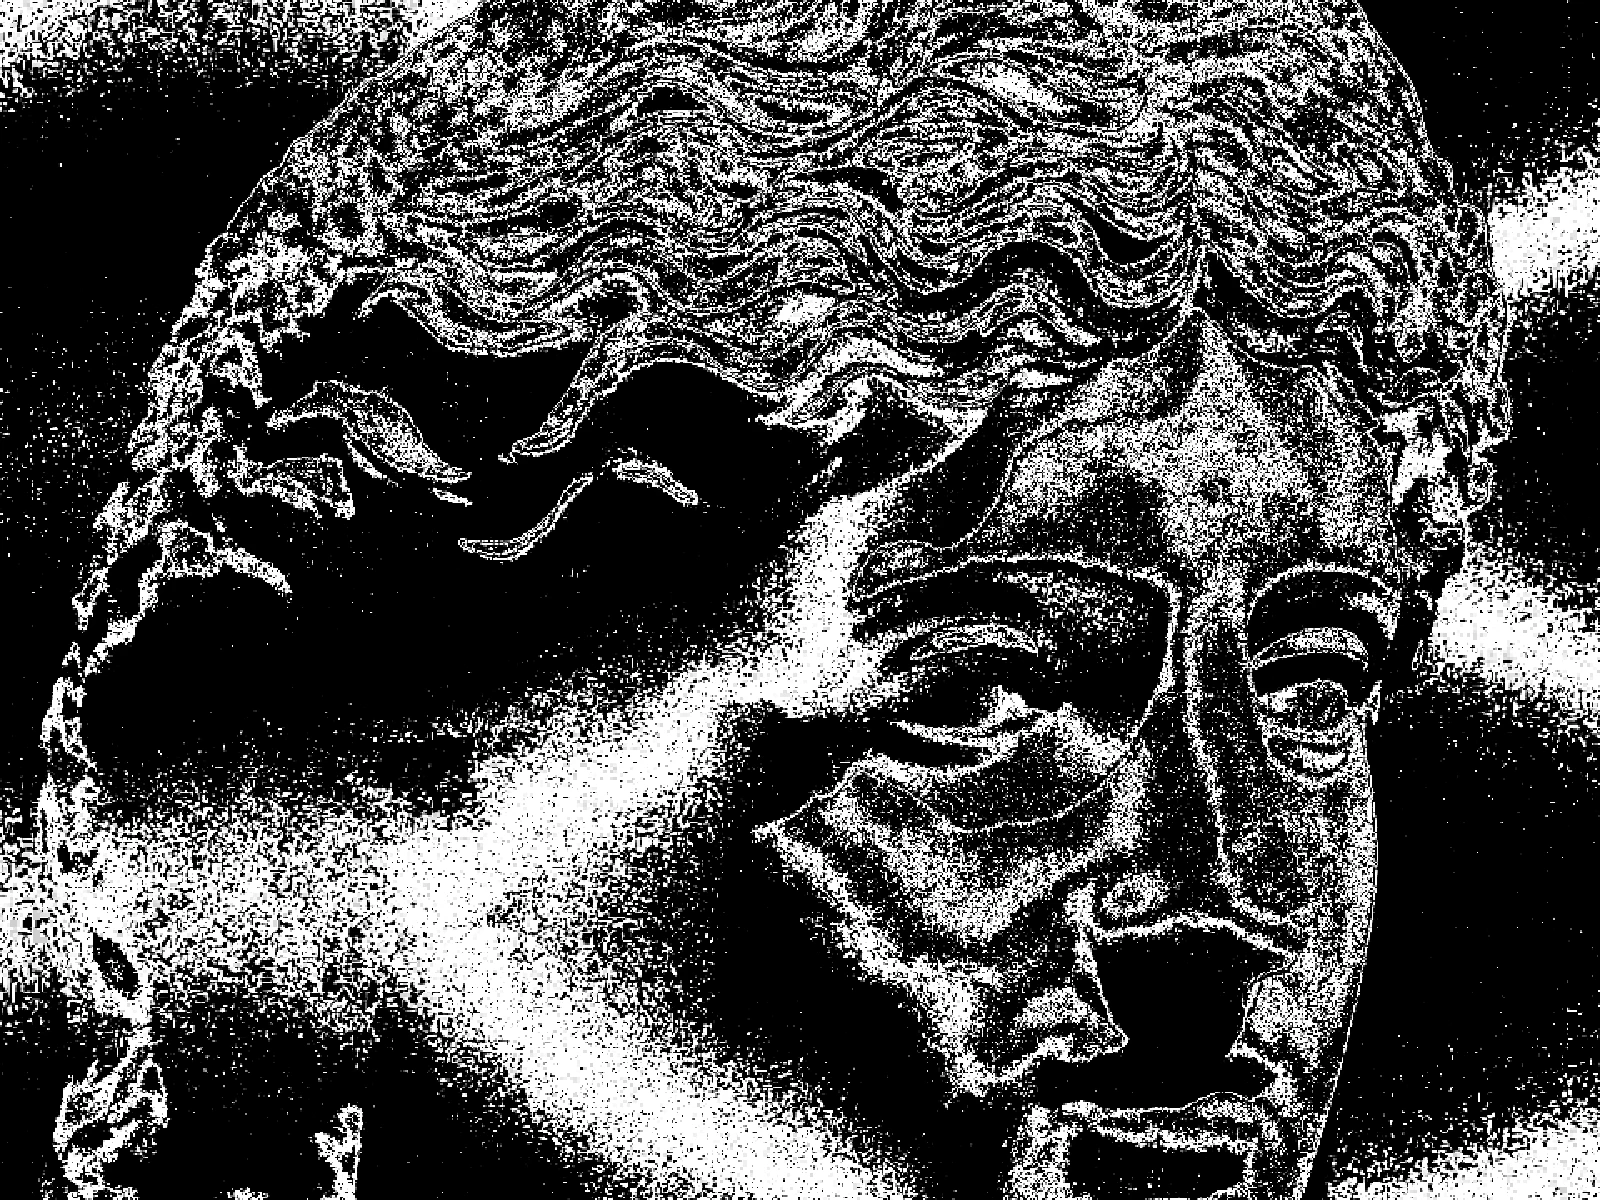
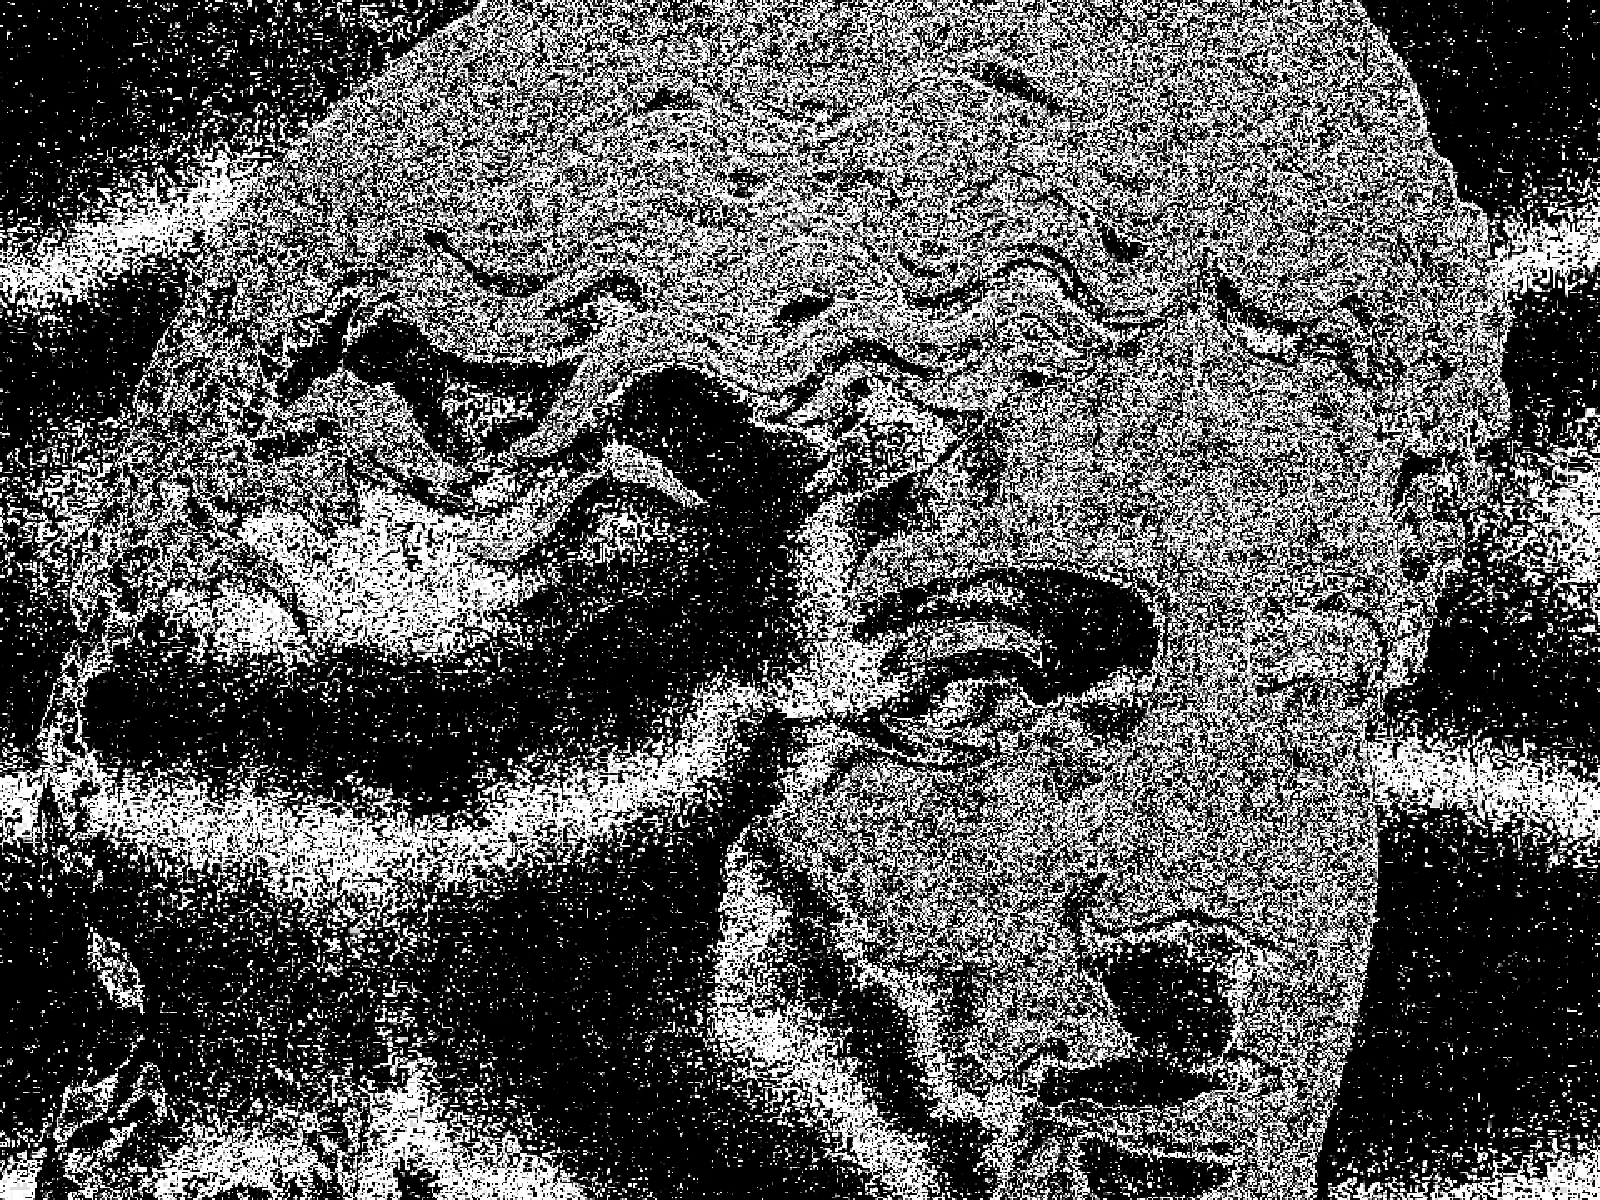
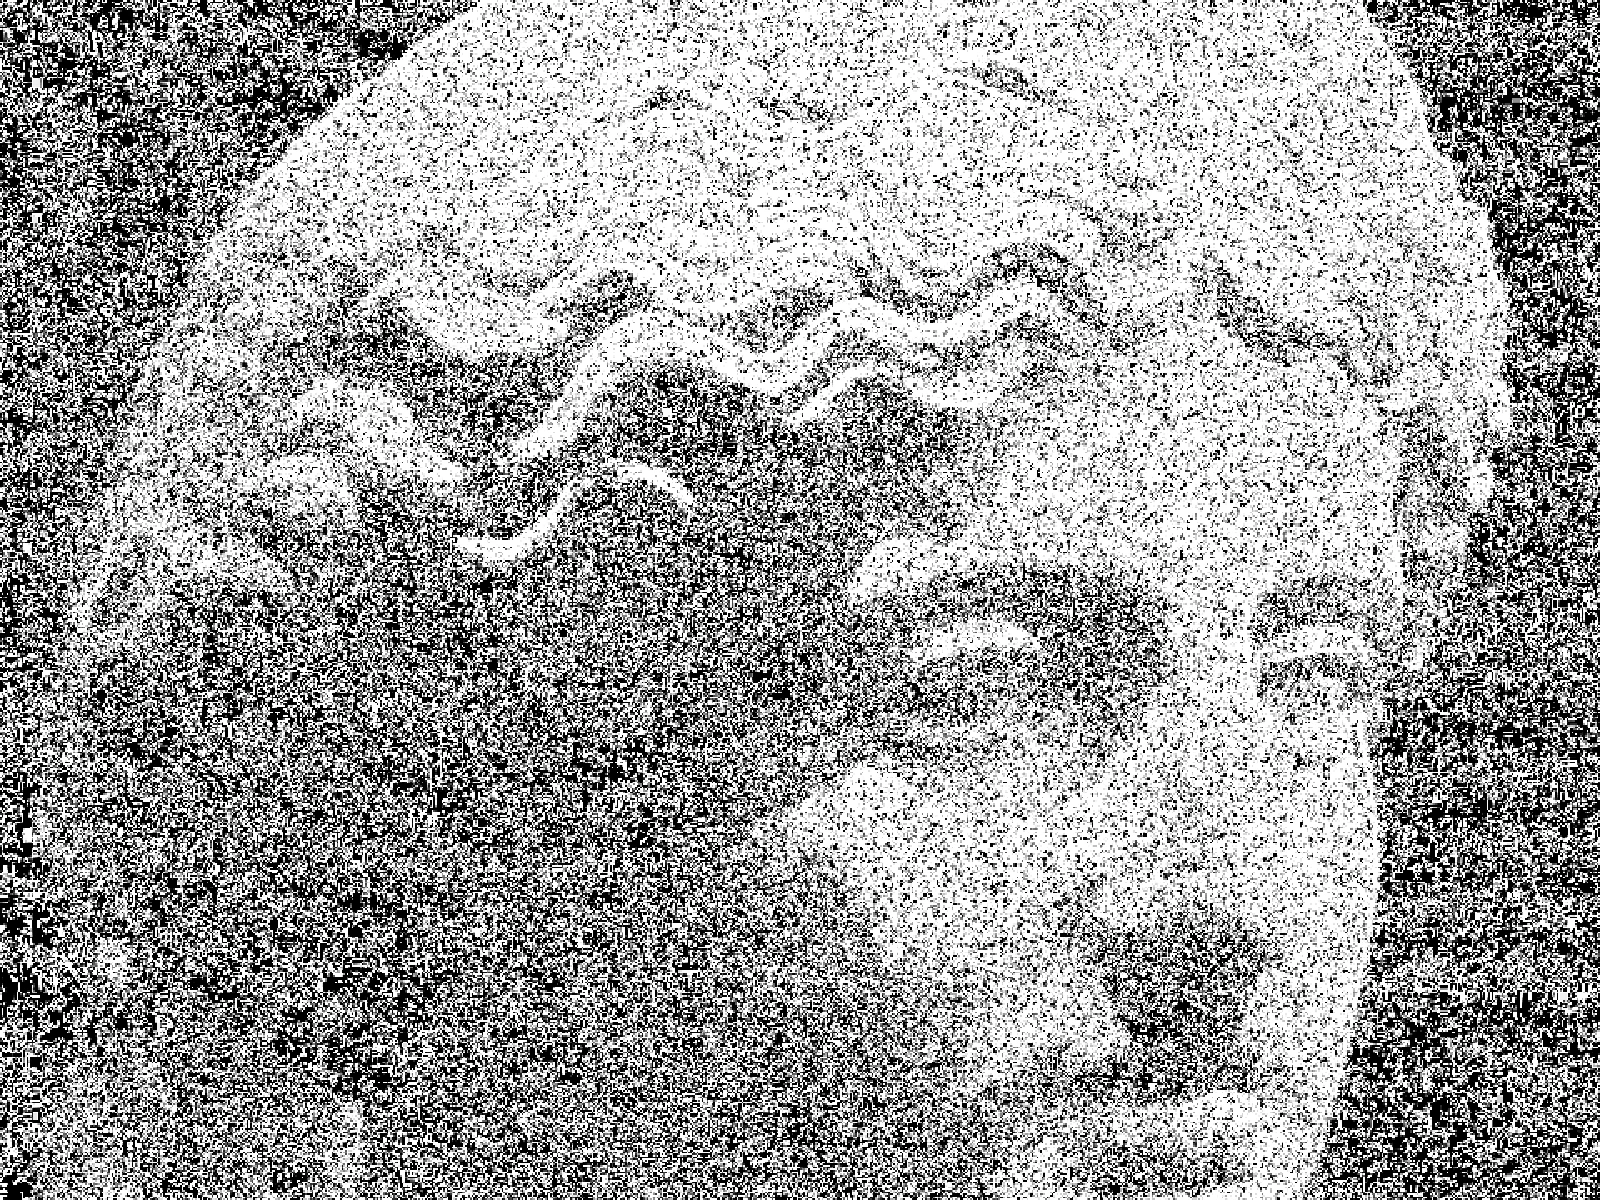
This effect slices the image into bands of equal brightness and draws a line at every boundary, which is topographic contouring applied to tone rather than to elevation. LEVELS runs from 6 to 40 with a default of 12 and sets how many bands the range is cut into, so it directly controls line density. WARP from 0 to 10 displaces the bands before they are traced, which breaks the mechanical regularity that makes a plain threshold look like a chart. LINE WIDTH sets stroke weight from 0.02 to 1. In kott the lines are generated per pixel, so they stay hairline at export size.
04/ FAQ
- What is a contour line effect?
- A contour line effect draws a line wherever image brightness crosses a fixed step, producing the concentric bands of a topographic map. It describes shape through lines of constant value.
- What LEVELS value should I use for contours?
- The default of 12 keeps the form readable. Below 8 only the largest tonal shifts get traced, and above about 30 the lines crowd together and the subject disappears into them.
- Why does WARP matter for a contour effect?
- Without it, contours follow tone exactly and read as a machine-generated chart. WARP displaces the bands slightly so the lines look drawn rather than computed.